

- For six months, Bitcoin has traded between $78,000 and $110,000, and analysts expect a breakout soon.
- Technical indicators point to $117,000 as Bitcoin’s next major resistance level to break.
- Multiple chart patterns suggest that Bitcoin could reach $123,000 to $130,000 if it closes above resistance zones.
Bitcoin continues to trade within established parameters as market analysts identify key resistance levels that could determine the cryptocurrency’s next major price movement. The digital asset trades at $109,060, positioning itself near critical technical thresholds.
Market data reveals Bitcoin has maintained trading activity between $78,000 and $110,000 since January 2024. This range represents a significant consolidation period for the world’s largest cryptocurrency by market capitalization.
Short-Term Holder Metrics Point to Upward Pressure
Onchain analytics platform Glassnode highlights the importance of short-term holder (STH) cost basis bands in determining Bitcoin’s current price action. These metrics track the average purchase price of investors holding Bitcoin for periods shorter than 155 days.
The upper boundary of the STH cost basis currently sits at $117,113. Bitcoin tested this level once during late May when the cryptocurrency reached its current all-time high of $112,000. Analysts suggest a successful retest of this resistance could propel Bitcoin toward the $117,000 target.
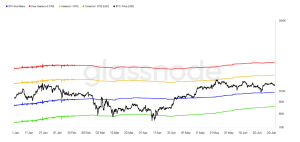 Market intelligence data indicates this level functions as the upper band for short-term price movements. The metric provides traders with concrete reference points for potential breakout scenarios.
Additional supporting indicators include the market value realized value (MVRV) metric. This measurement tool evaluates whether Bitcoin trades at overvalued or undervalued levels relative to its realized price. Current MVRV readings suggest Bitcoin maintains room for expansion before reaching extreme profit-taking zones around $123,000.
Technical Analysis Reveals Key Breakout Patterns
Prominent market analyst Rekt Capital identifies Bitcoin’s interaction with a multimonth descending trendline as crucial for future price direction. The analyst notes that Bitcoin is currently retesting this technical formation at the $109,000 level.
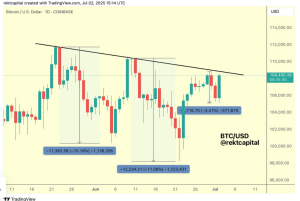
Chart analysis demonstrates that the downward trendline represents a significant resistance point. Bitcoin requires a daily close above this level, followed by a successful retest as support to confirm a genuine breakout pattern.
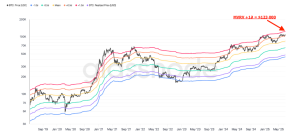
Trading specialist Jelle presents an alternative perspective through bull flag pattern analysis. This technical formation suggests that Bitcoin must close above $110,000 daily to trigger upward momentum. The measured target for this pattern extends to $130,000.
Multiple technical indicators converge around current price levels, creating a decision point for Bitcoin’s medium-term trajectory. The cryptocurrency’s ability to maintain above key support levels while challenging resistance zones will determine whether consolidation continues or gives way to renewed upward movement.
Disclaimer
The content shared on KryptoVaultDaily is for informational purposes only and does not constitute financial or trading advice. We do not offer guarantees and assume no responsibility for investment decisions based on the material provided. Always research and seek guidance from a licensed financial advisor before trading cryptocurrency or investing.